K|Dash
A minimal and beautiful dashboard, as a weather balloon.
- 10,514 Raised
- 687 Views
- 3 Judges
Team
Gallery
Description
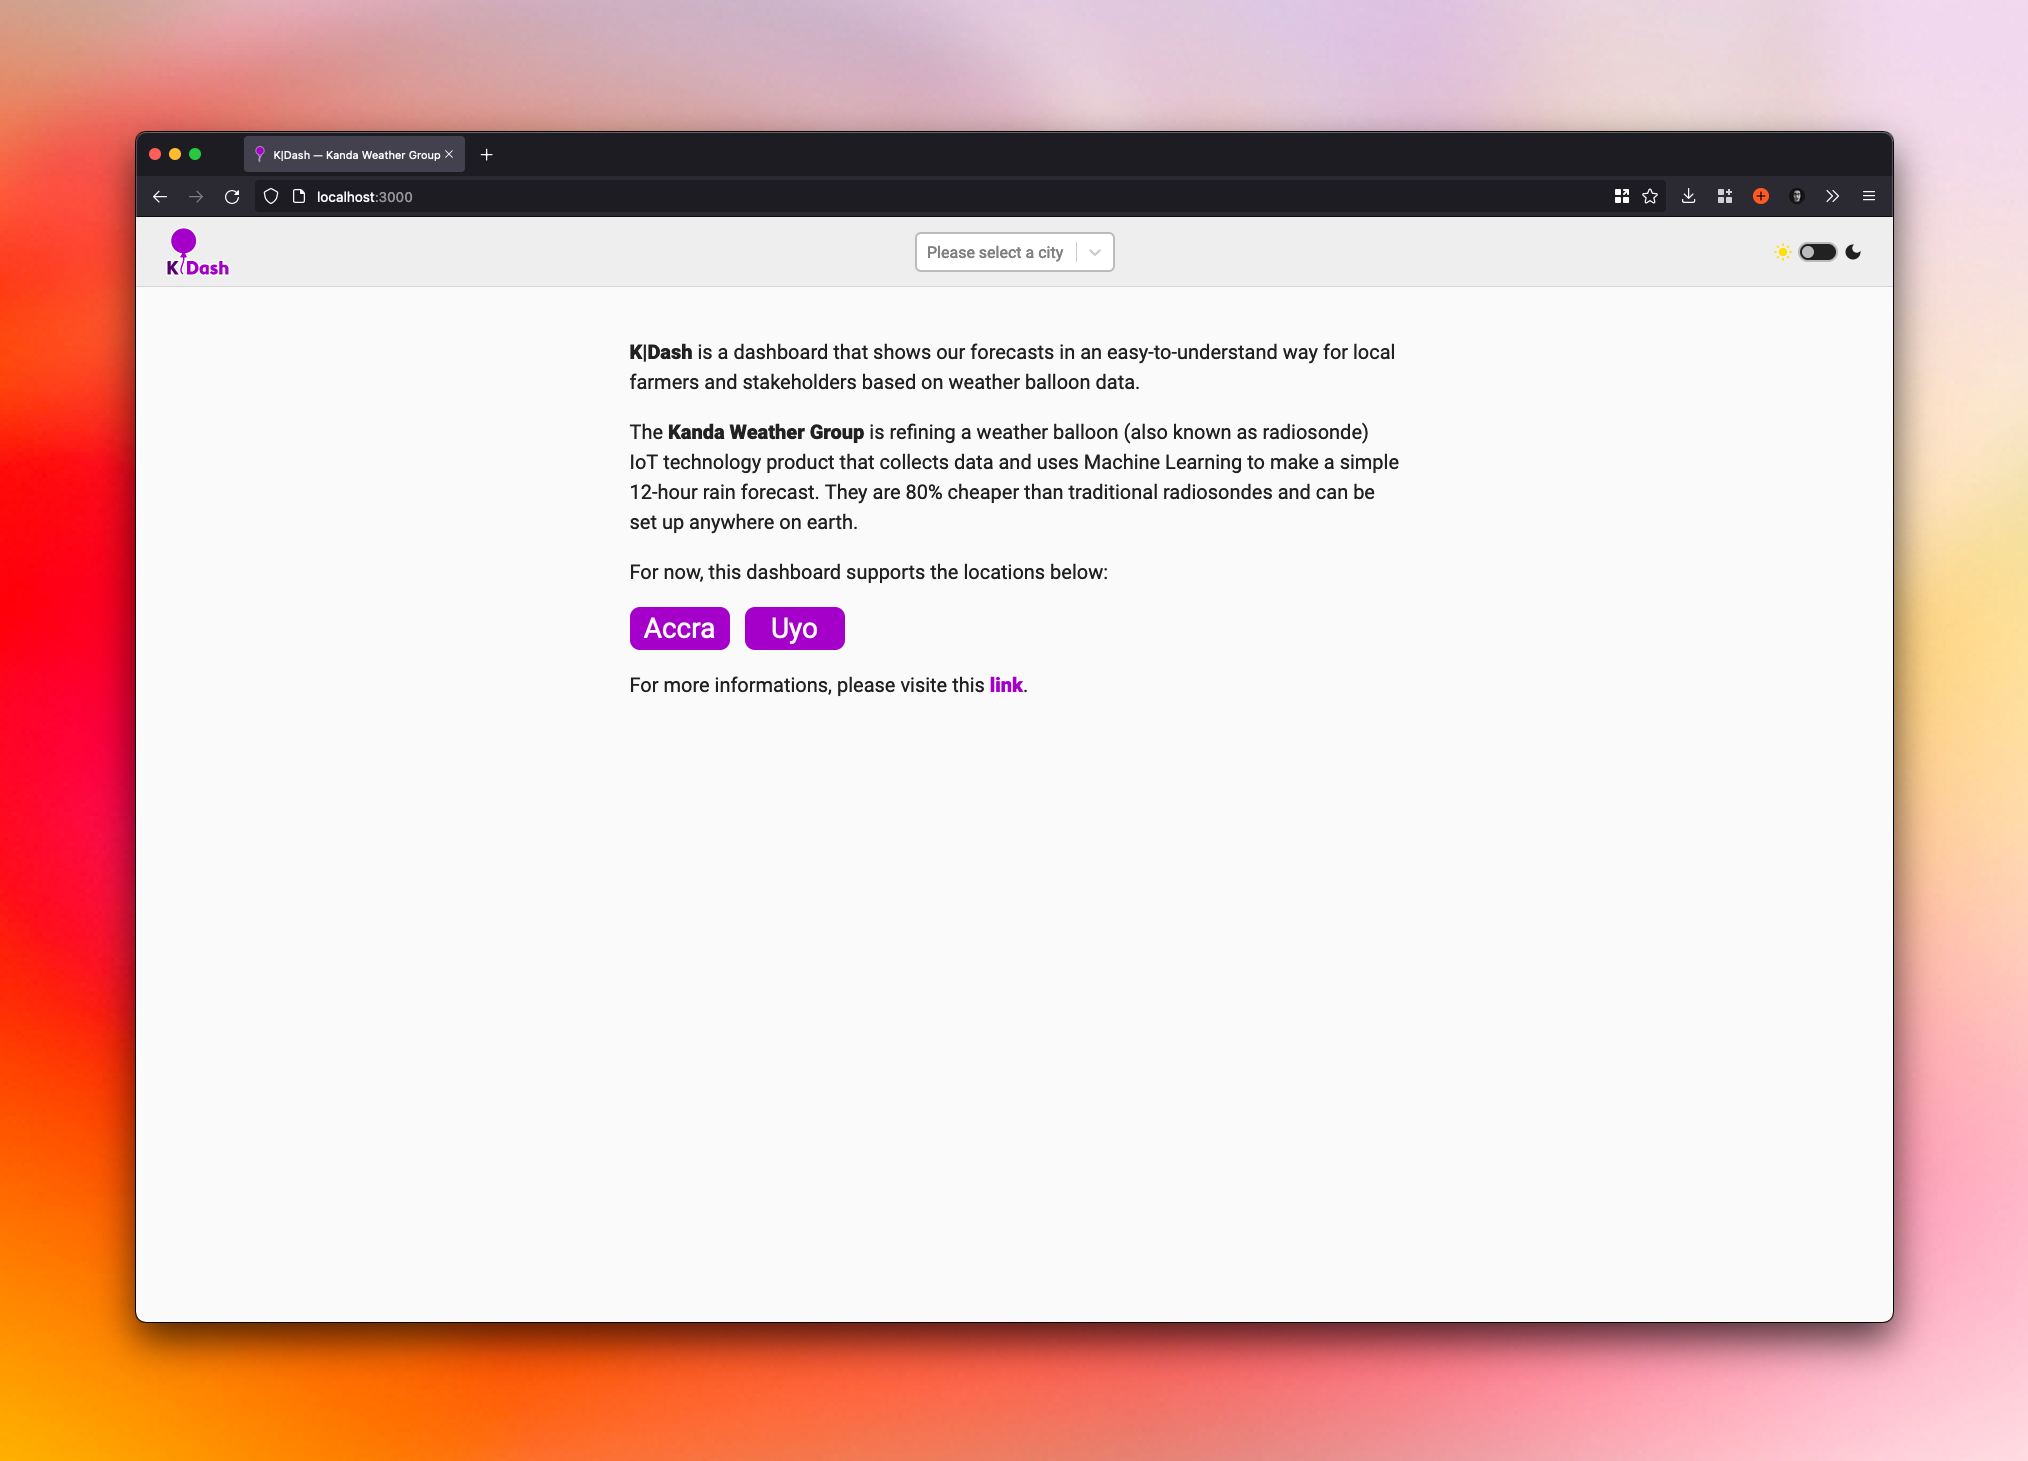
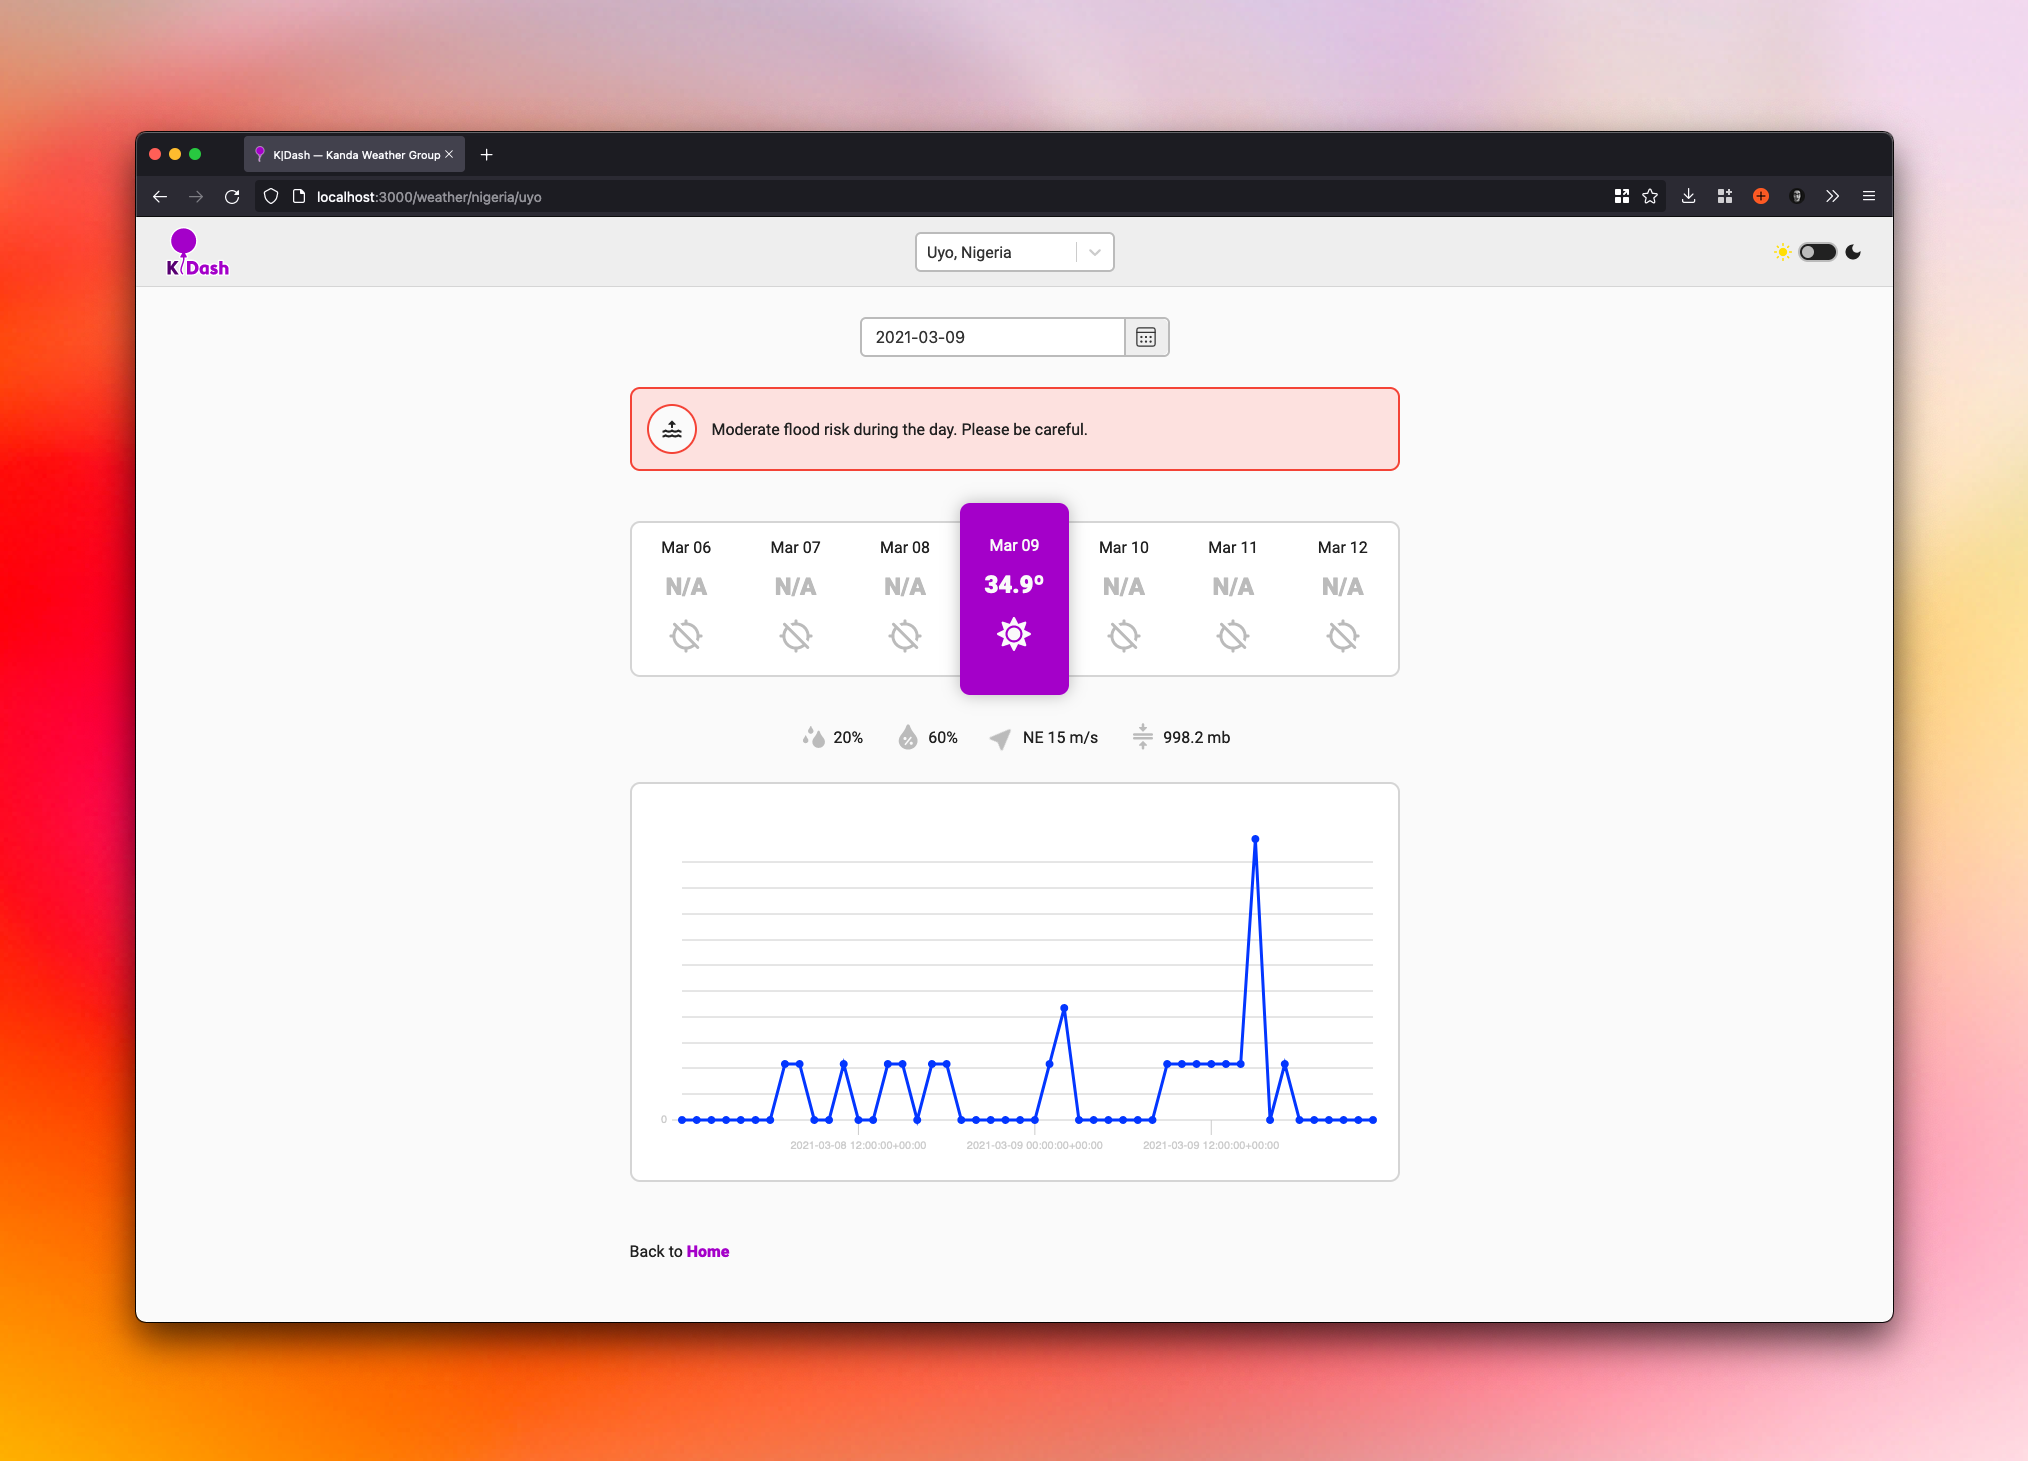
The K|Dash project is a dashboard that shows the forecasts for local farmers and stakeholders based on weather balloon data in a simple UI. From Kanda Weather Group, the balloon is a weather balloon that collects data and uses Machine Learning to make a simple 12-hour rain forecast.
The data used in K|Dash comes from two places, a .json file based on the "forecasts.txt" generated by the weather balloon and the dClimate API. K|Dash also has a preventive alerts component regarding flood risk and air quality.
The Challenge
Based on the examples presented, K|Dash fits into "The Exceptional Dashboard":
- Handles many locations;
- Support multiple dates;
- Two sources of data;
- Empty and loading states;
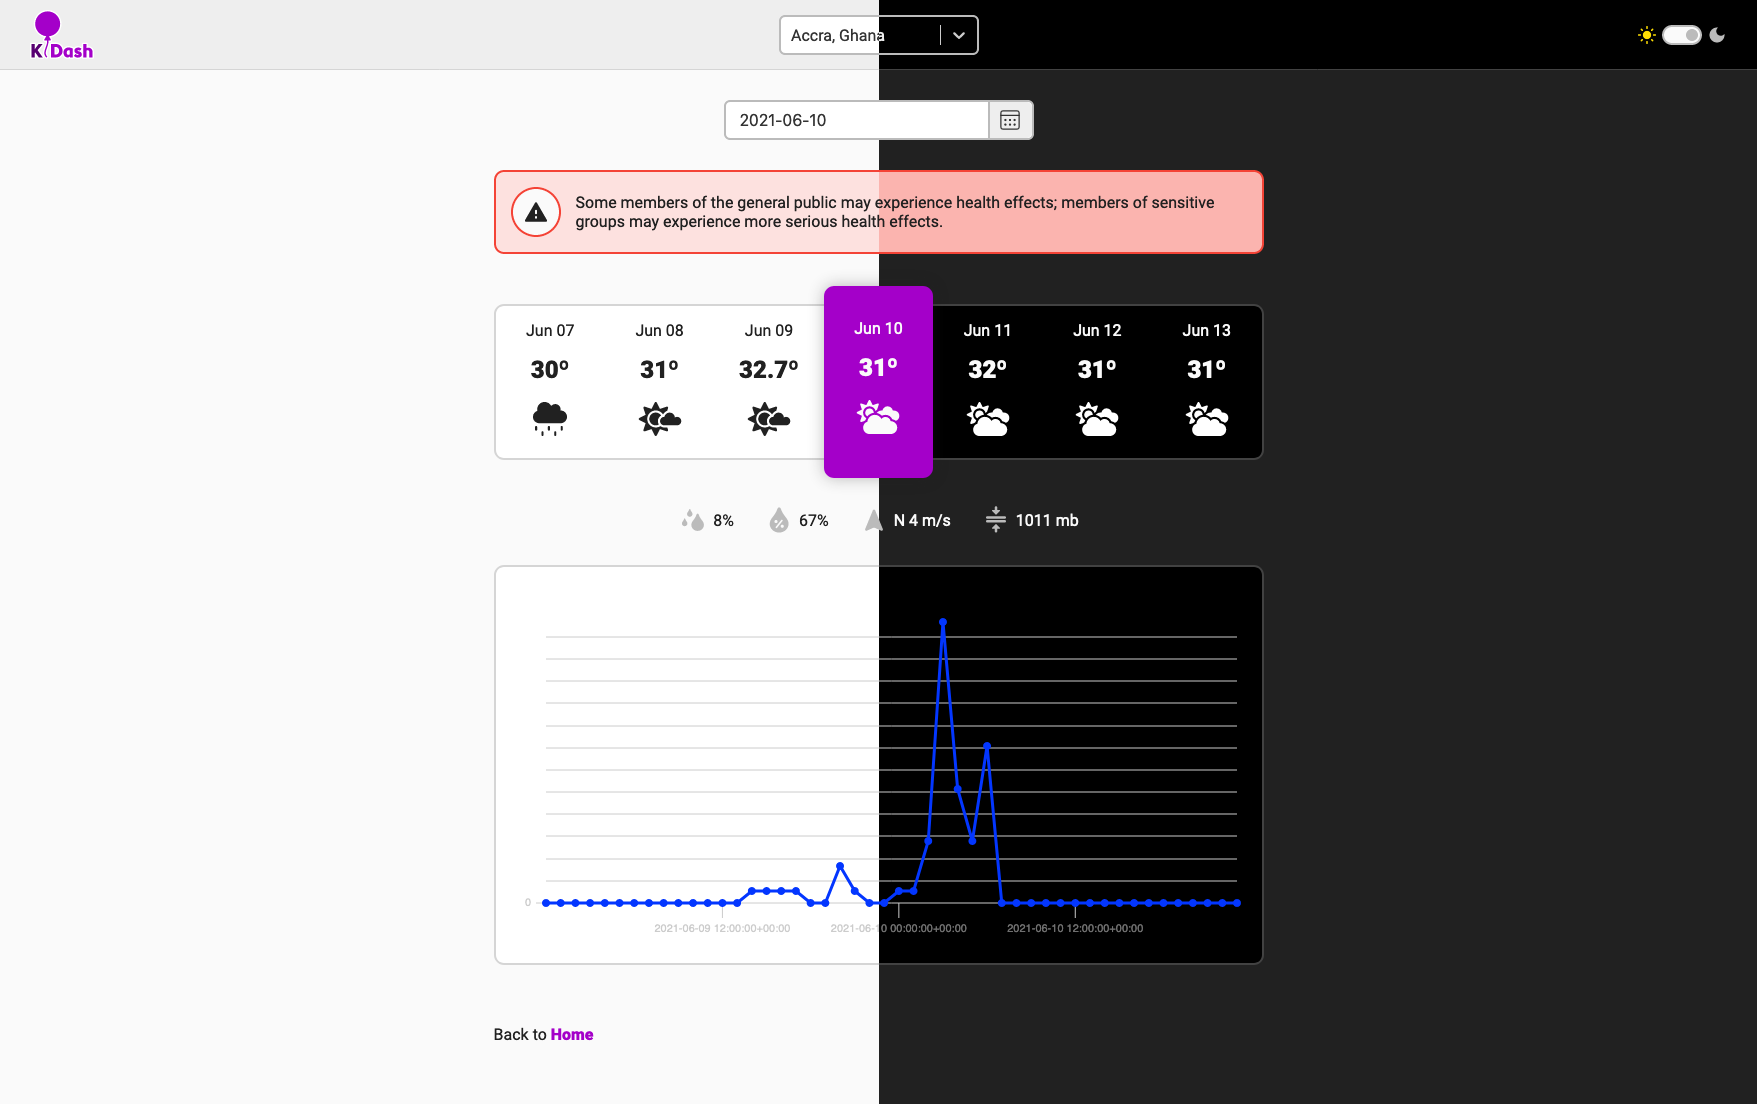
- Alerts about air quality and flood risk;
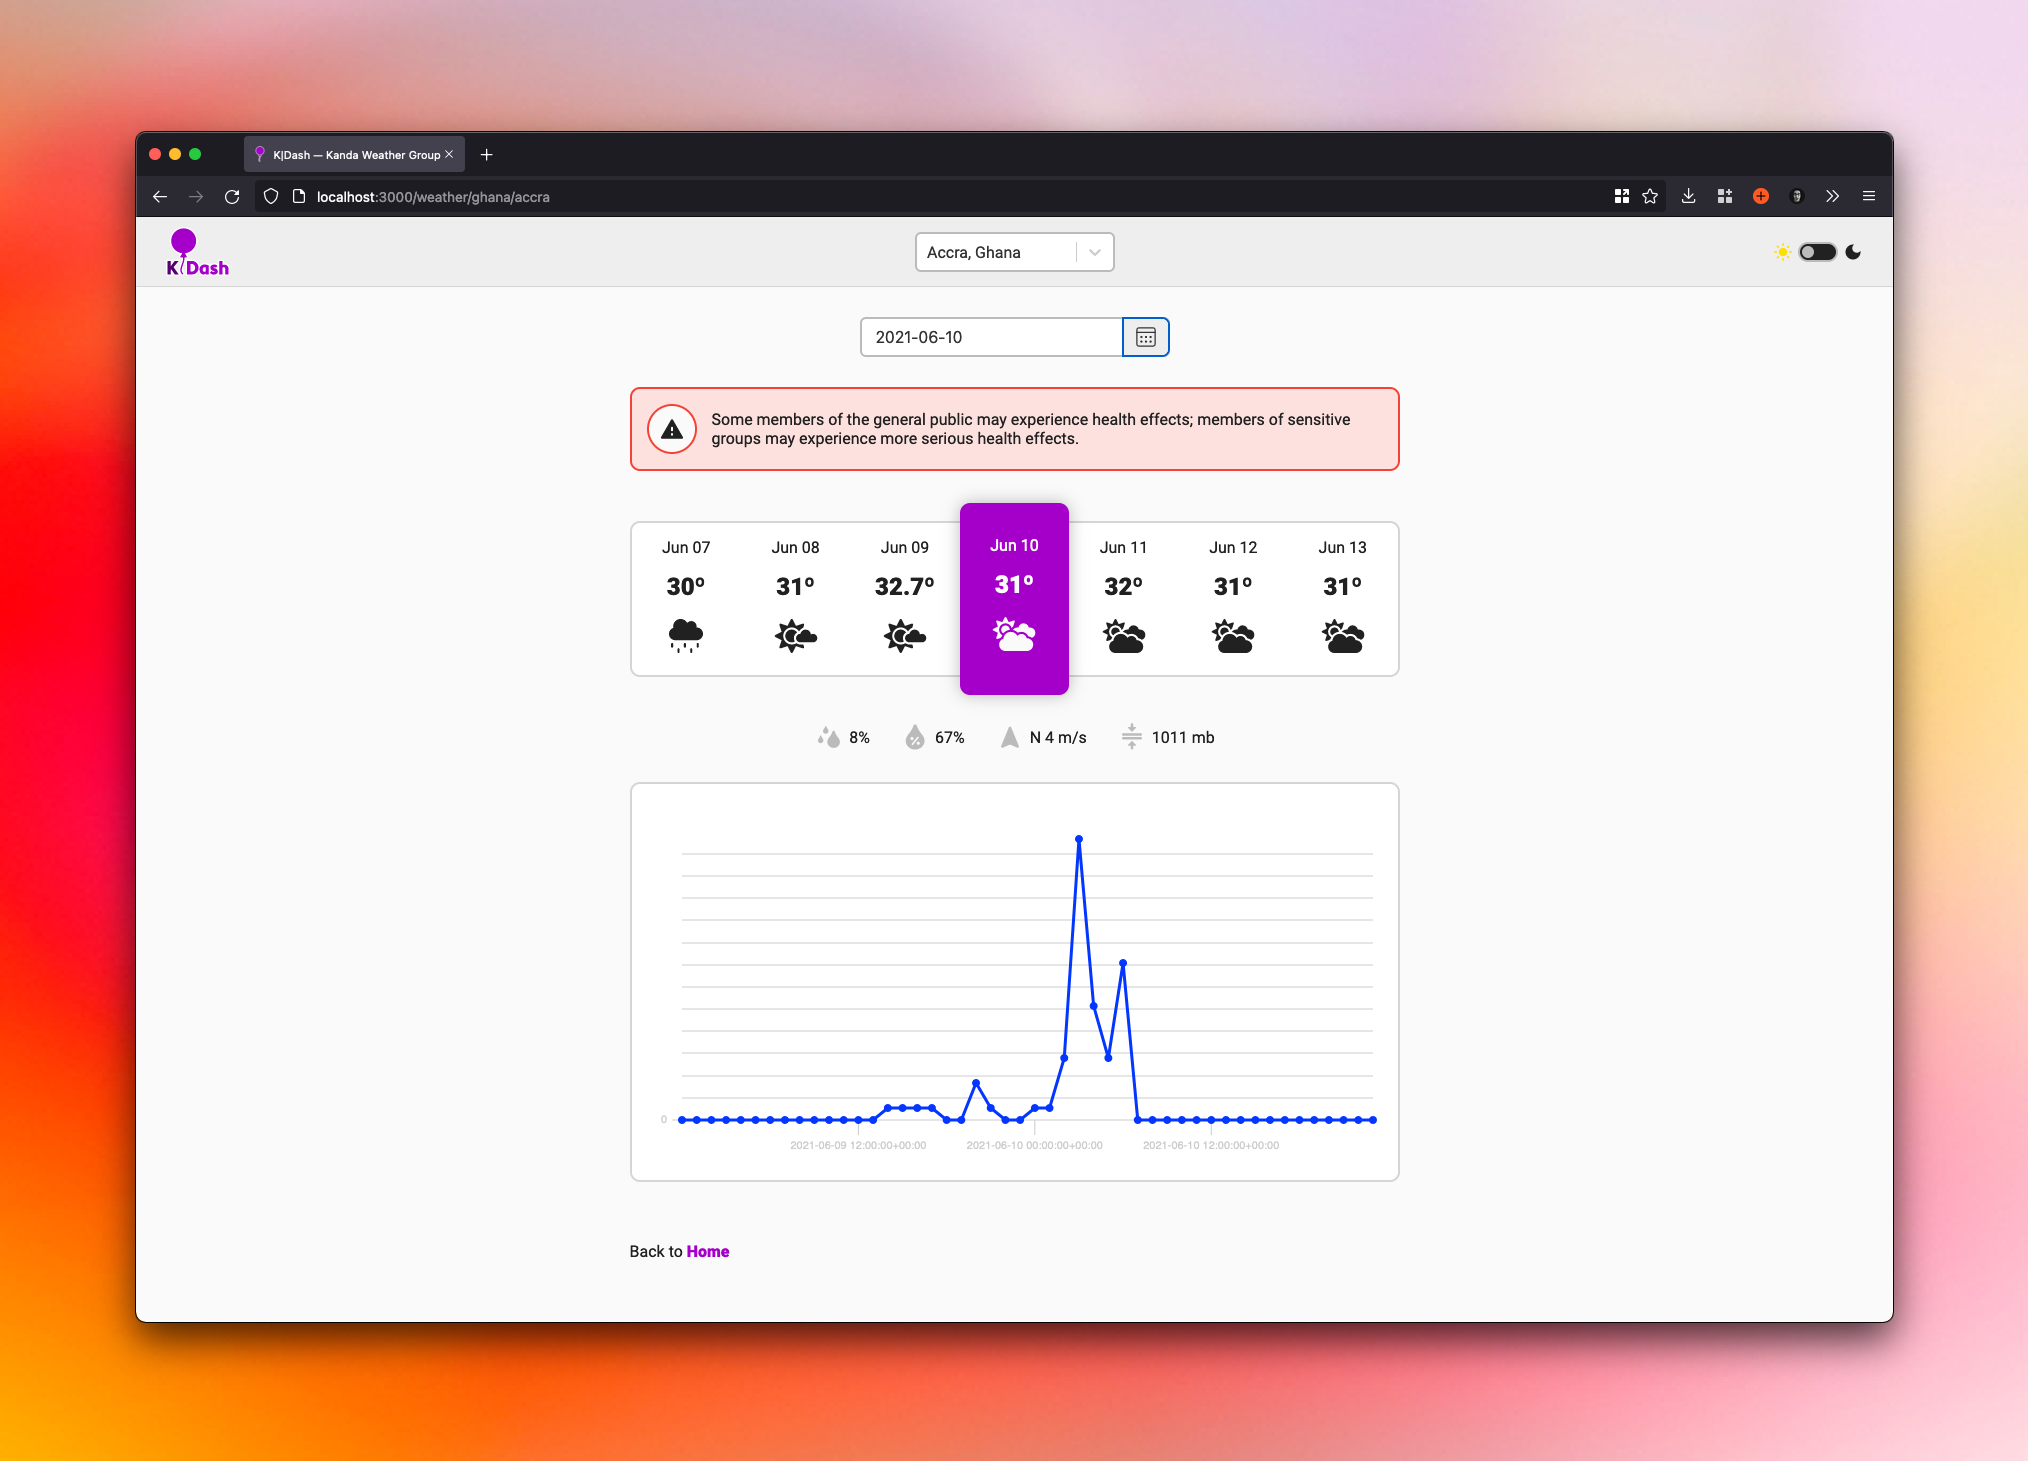
- Clean UI;
- Illustrate a variety of forecast types;
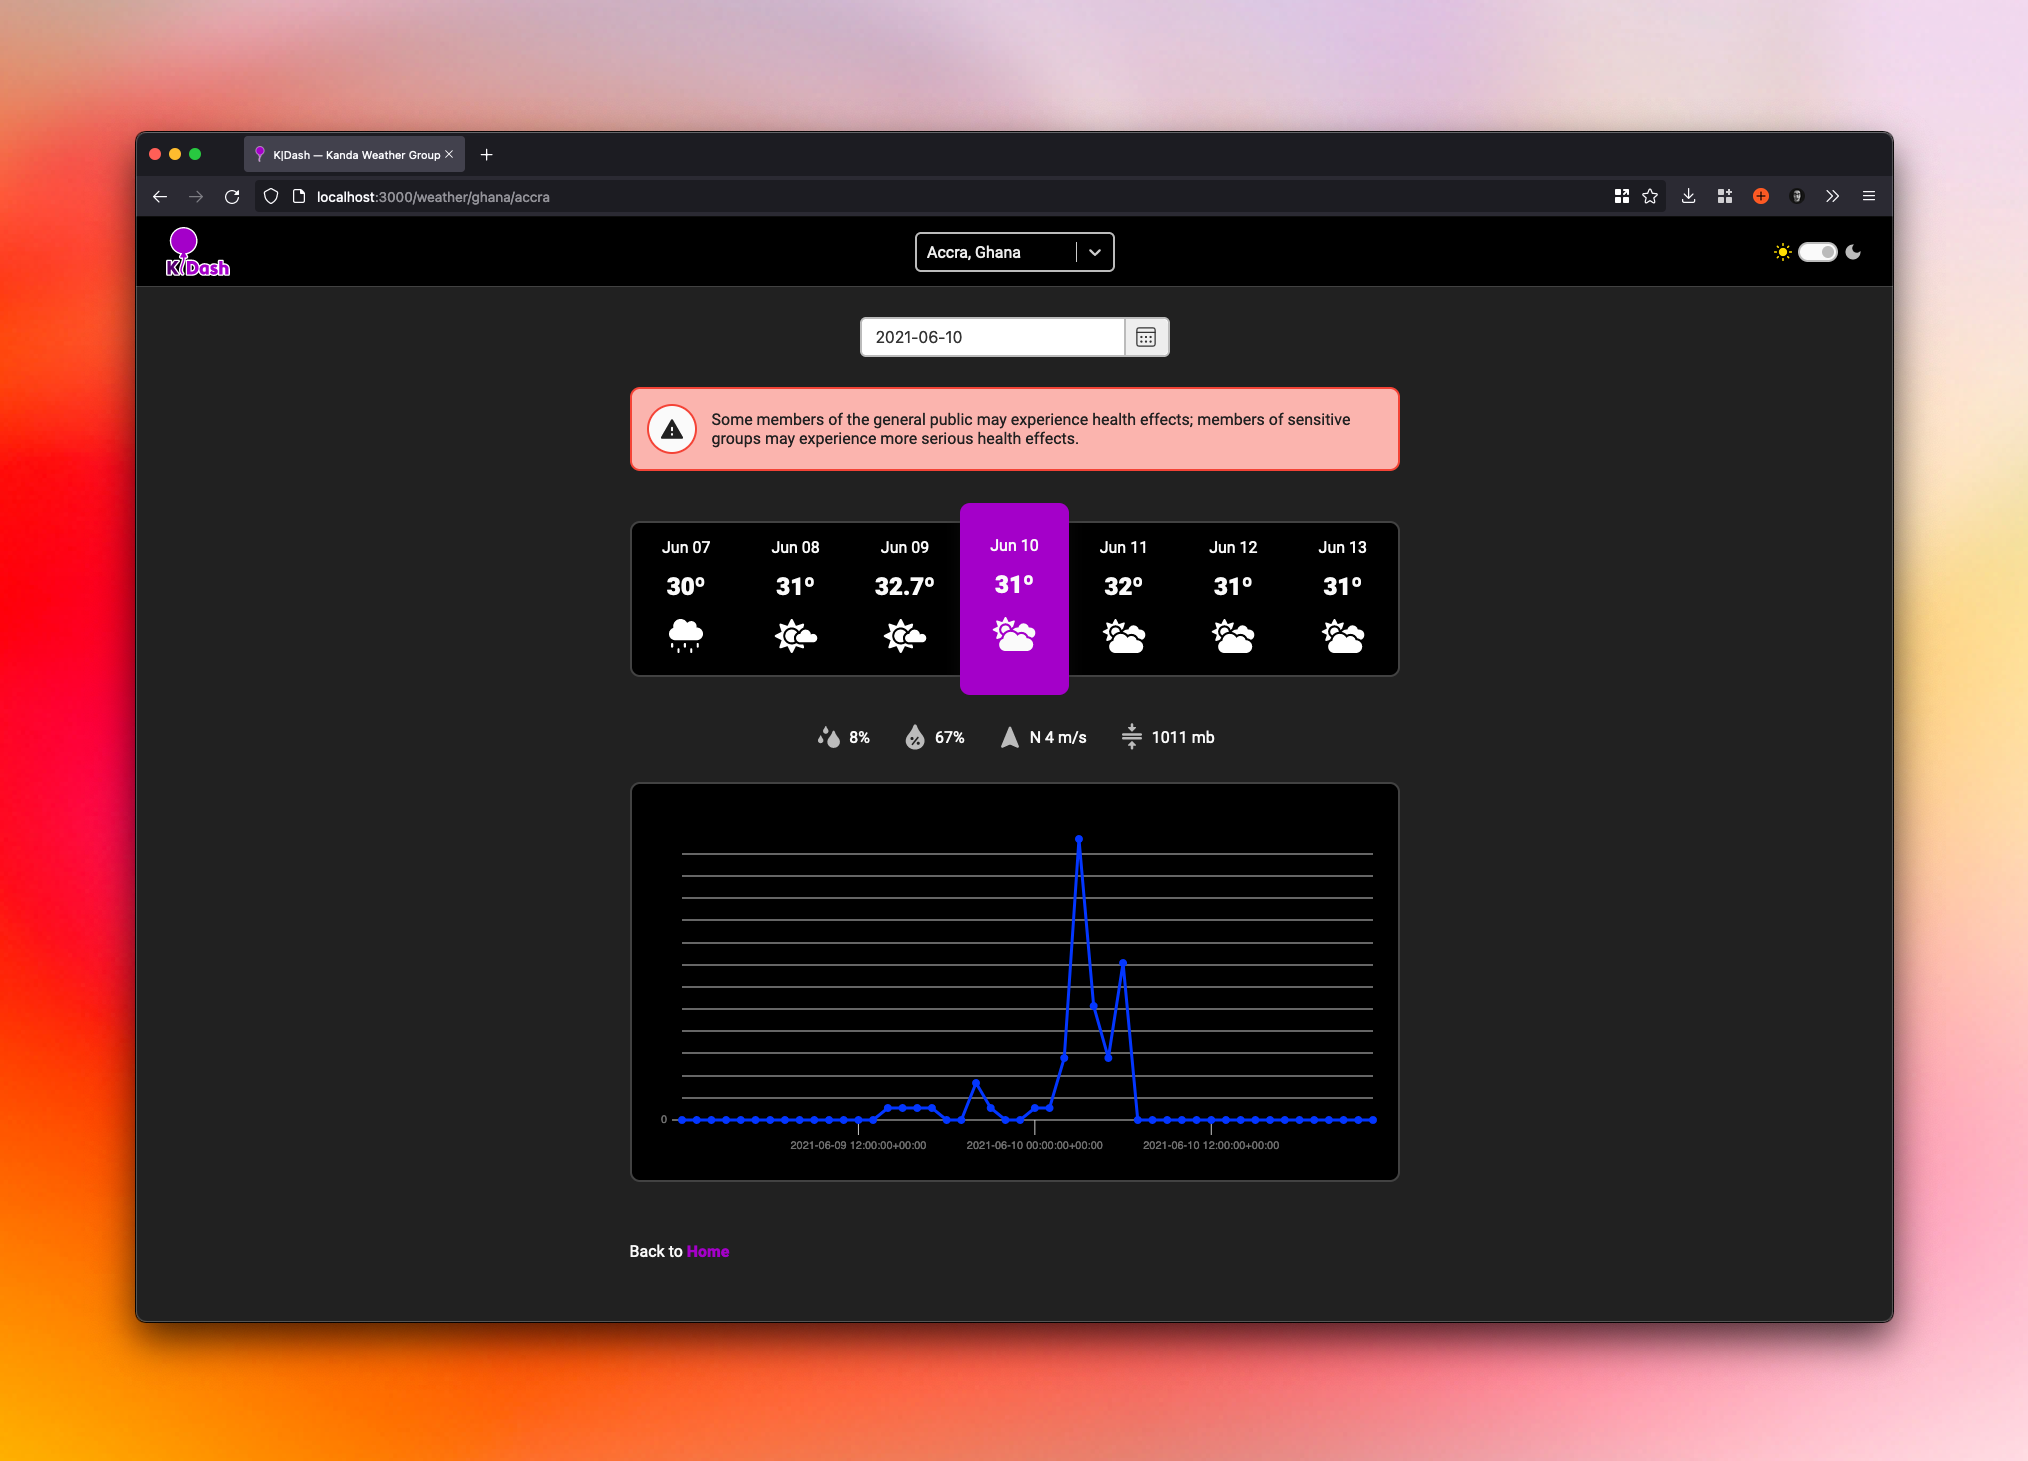
- Support light/dark themes;
- Full responsive;
- Offline support (WPA).
Alerts
There are two types of alerts:
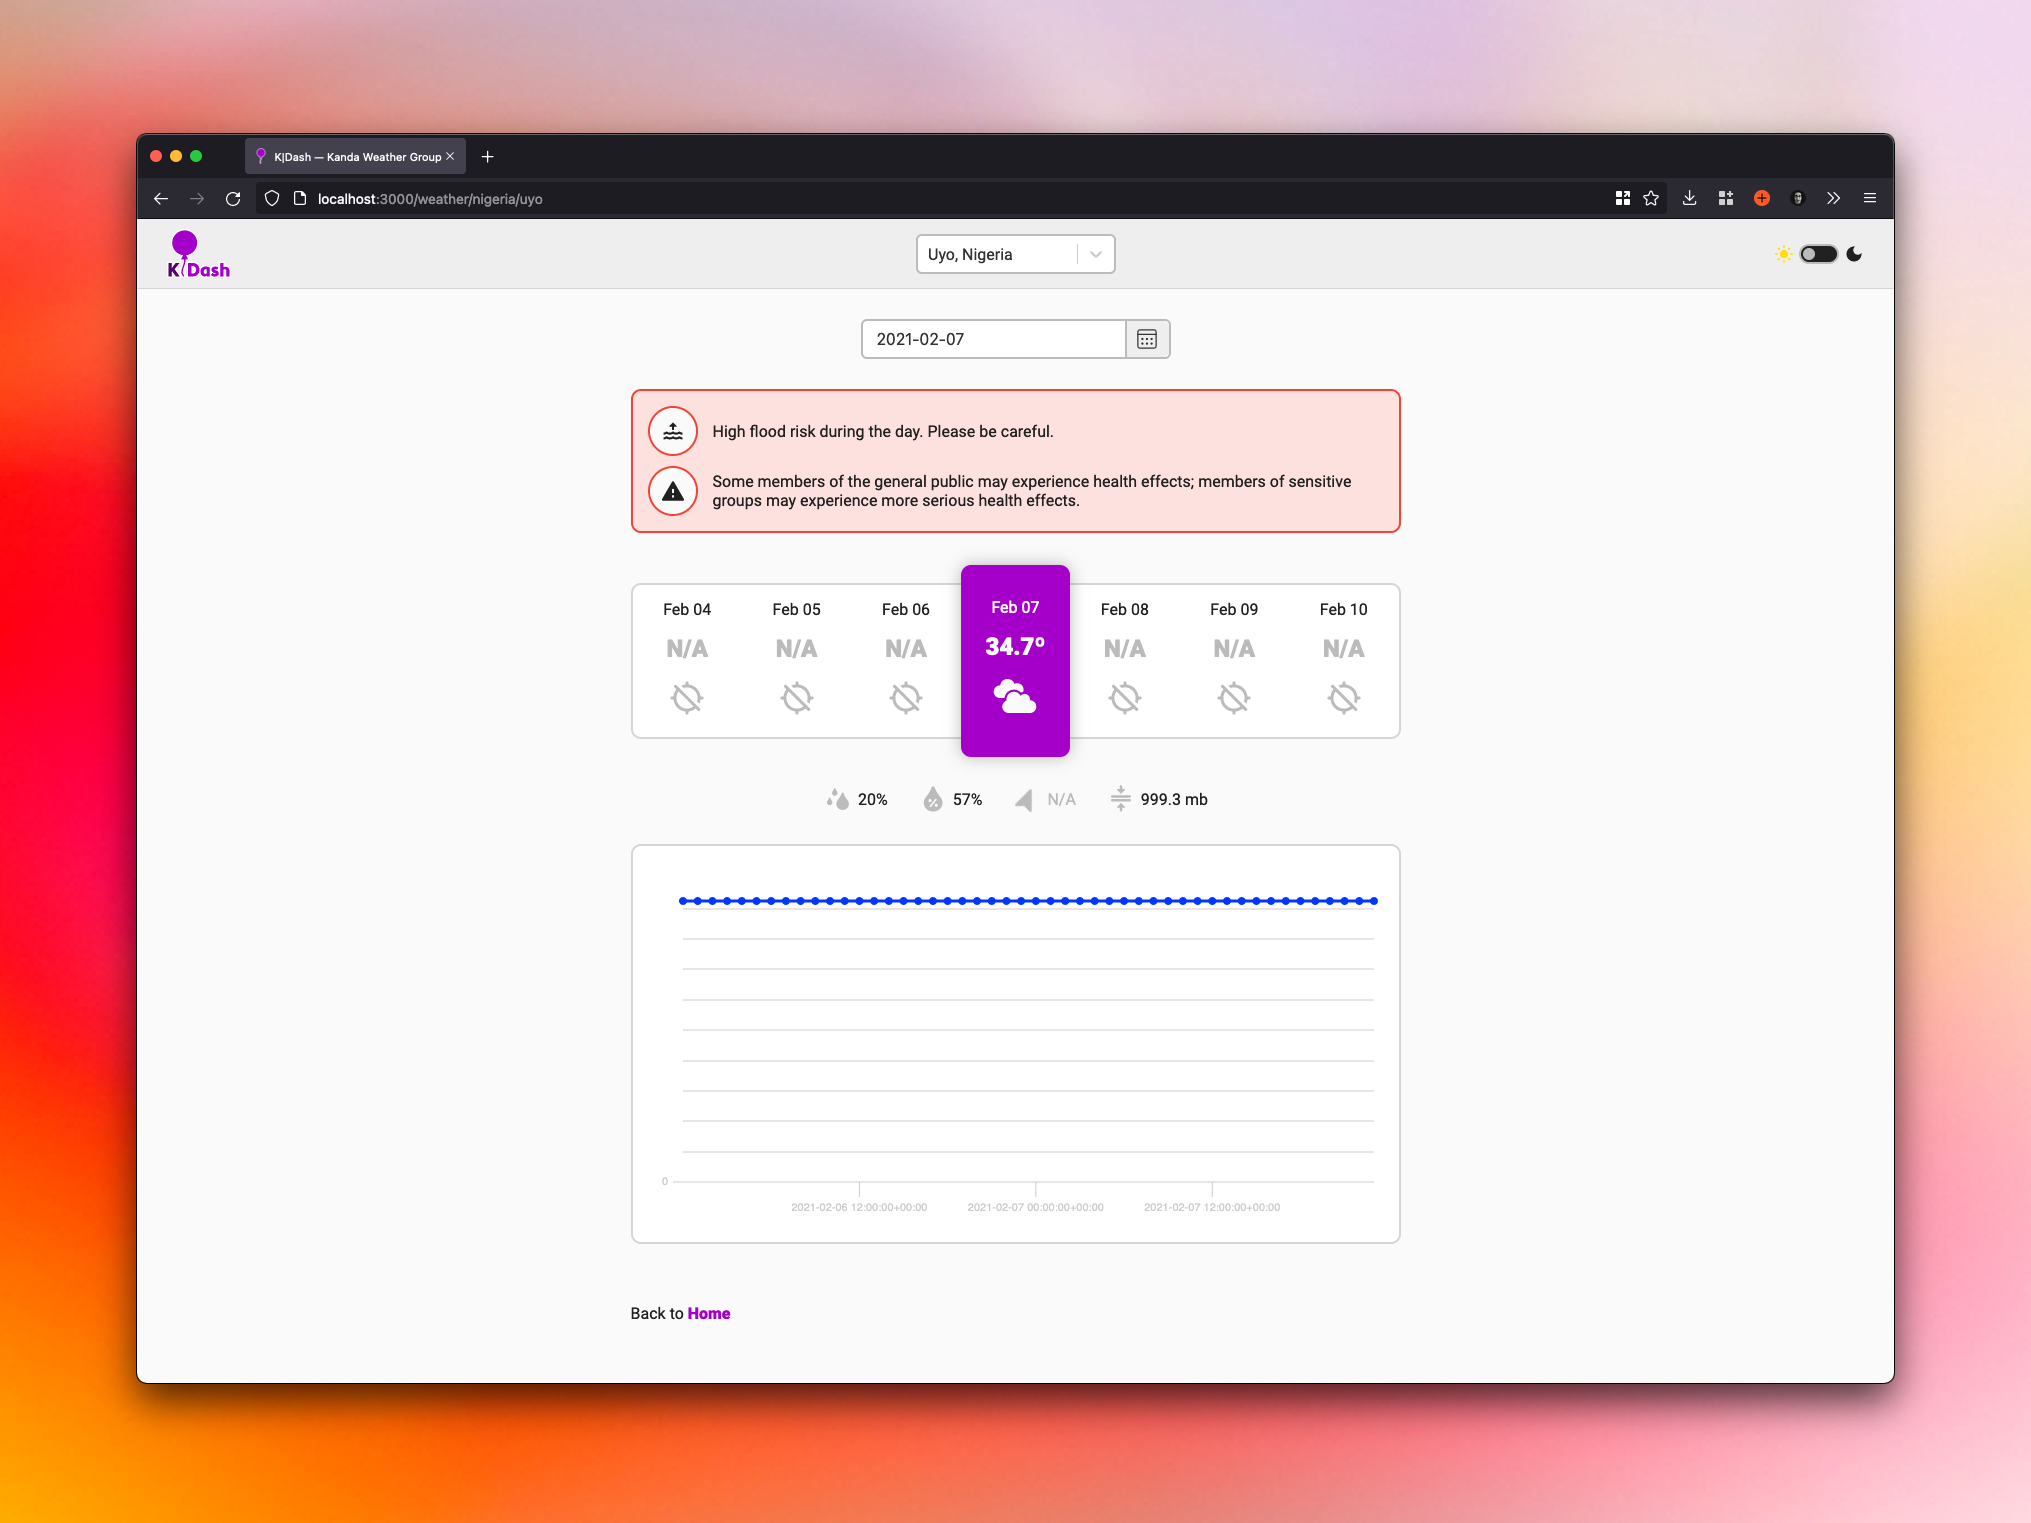
- Air Quality: this alert is based on the US Air Quality Index (AQI). It uses the wind speed values of the previous days to present a "moderate" and a "high risk" alert if the last day or the two previous days have not had the wind with a minimum speed of 5 m/s.
- Flood Risk: this alert is based on dClimate API data referring to `era5_surface_runoff` and also has two alert levels, "moderate" and "high risk", based on the percentage of values read in a given period.
Offline Support
K|Dash supports offline mode (WPA) and synchronizes data if necessary when the internet is available. Receiving the data from the dClimate API takes about 15/20 seconds, so K|Dash will see if the user has data hosted locally and the date of this data. If more up-to-date information is available in the API, K|Dash will update it; otherwise, it will use the previously recorded data.
User Interface
K|Dash has a simple interface to be easy to understand and quick to use. In addition to information on temperature, precipitation probability, humidity, atmospheric pressure, wind speed, and direction, it also illustrates the following weather conditions:
- Sunny;
- Partly Cloudy;
- Mostly Cloudy;
- Cloudy;
- Rain;
- Light Rain;
- Heavy rain;
- Thunderstorm;
- Snow;
- Fire.
Easter Egg: the wind direction arrow rotates depending on the direction of the wind.
Dev Stuff
The project is developed using:
- React;
- Next.js;
- styled-components;
- dClimate API.
There is a flag in the next.config.js file that allows you to activate or not the "dev mode", which is fed by local information for demo and challenge purposes. This avoids the limit of requests that can be made to the API and the CORS Error.
CORS Error, what? The CORS Error is an error from a security mechanism that browsers implement called the same-origin policy, one of the most common cyber attacks, which allows a malicious website to take advantage of the browser's cookie storage system.
So, if we put the mockAPI: true and using cors-anywhere, that is a proxy server that adds CORS headers to a request, it's possible to test everything and see the magic happens on hooks/useSurfaceRunoffData.js hook.
Deployed: k-dash.netlify.app
GitHub: henriquemacedo/k-dash