- Hackathons
- Builders
- Organizations
- Learn
Wsaver
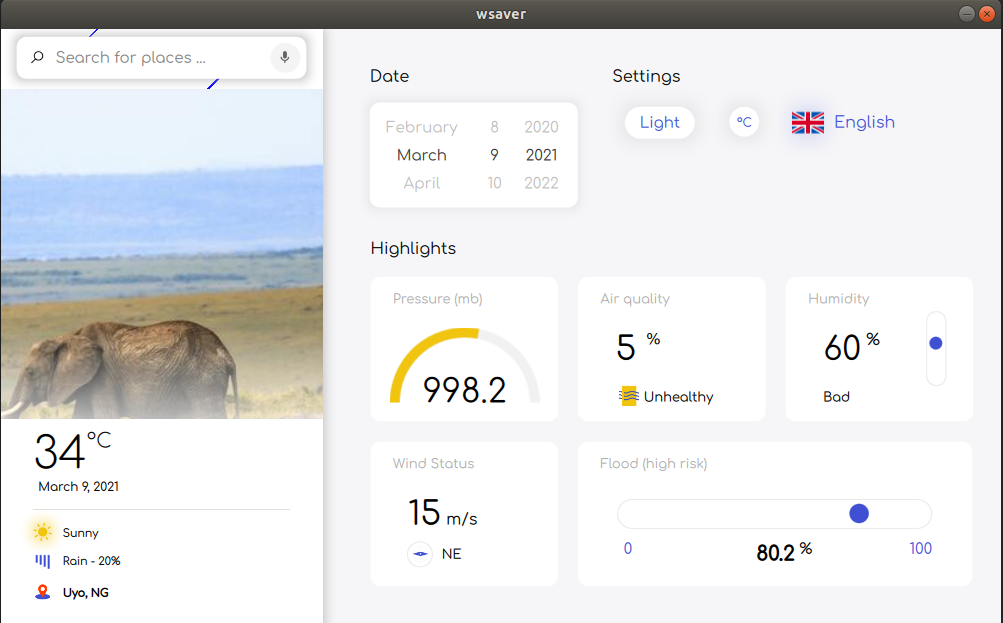
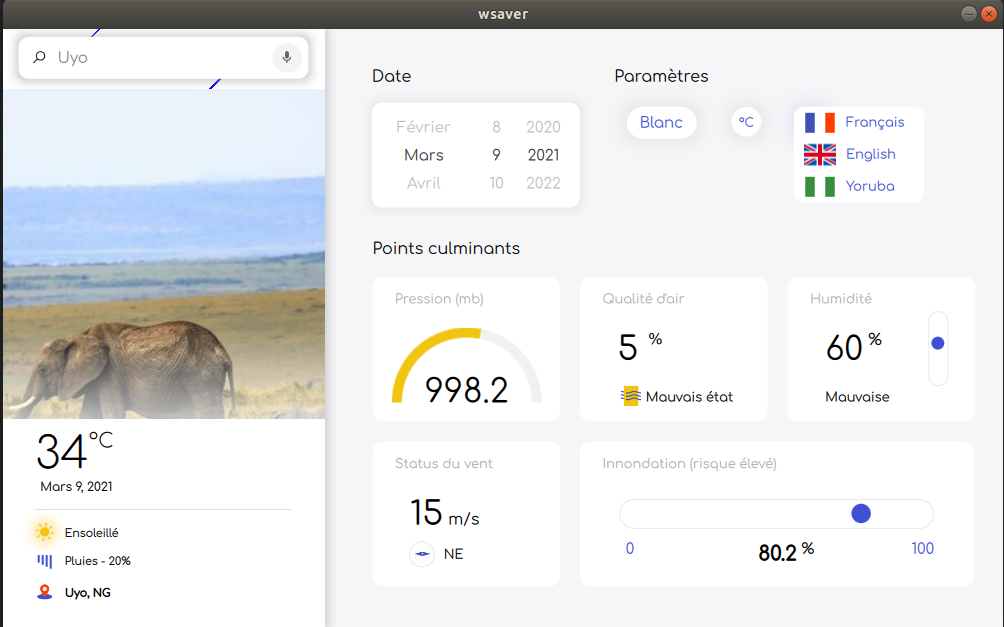
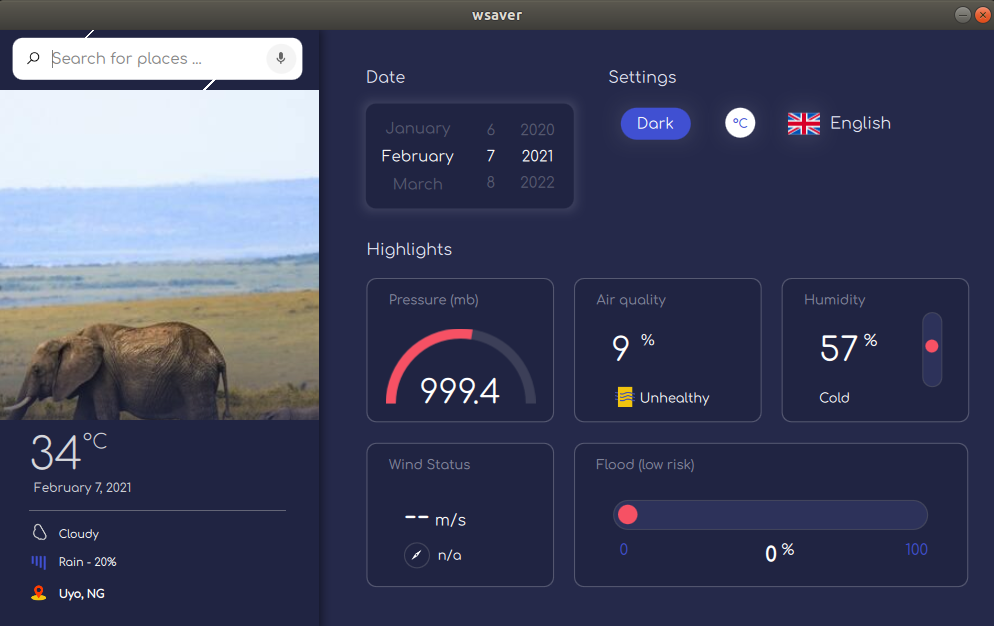
Ws : WEATHER SAVER. It is a dashboard which show weather station data in Real-Time
- 16,167 Raised
- 51 Views
- 3 Judges
Gallery

Description
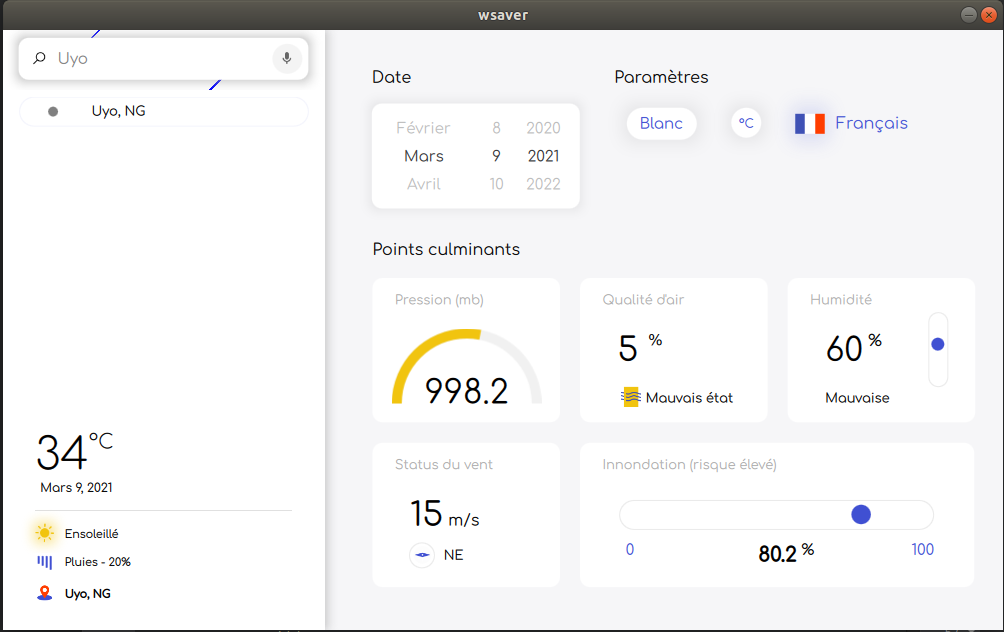
The dashboard has been designed with the Qt framework. Python and Javascript are used for the backend and especially for the heavy processing of the data returned by the API (CSV file). Qt is a widget toolkit for building graphical user interfaces as well as cross-platform applications that run on various software and hardware platforms such as Linux, Windows, macOS, Android, or embedded systems with little to no change in the underlying codebase while still being a native application with native capabilities and speed . Our dashboard is easy to use on the left side of the UI search for choosing a location, pick a date via our (Tumbler) and the language. Some fluid animations on changing the theme and Sunny condition which make you understand any weather data.
Our dashboard features:
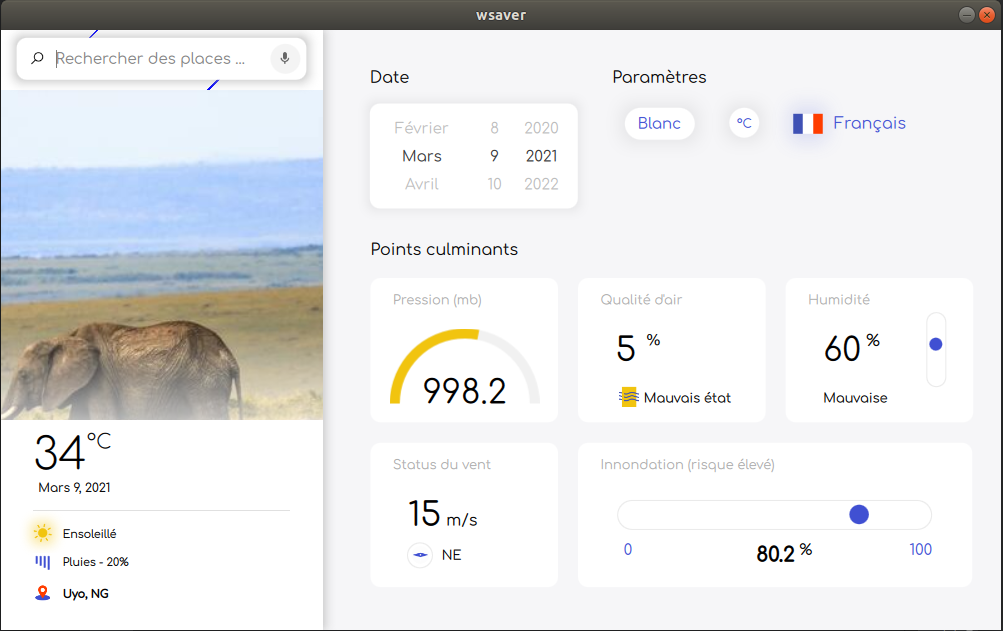
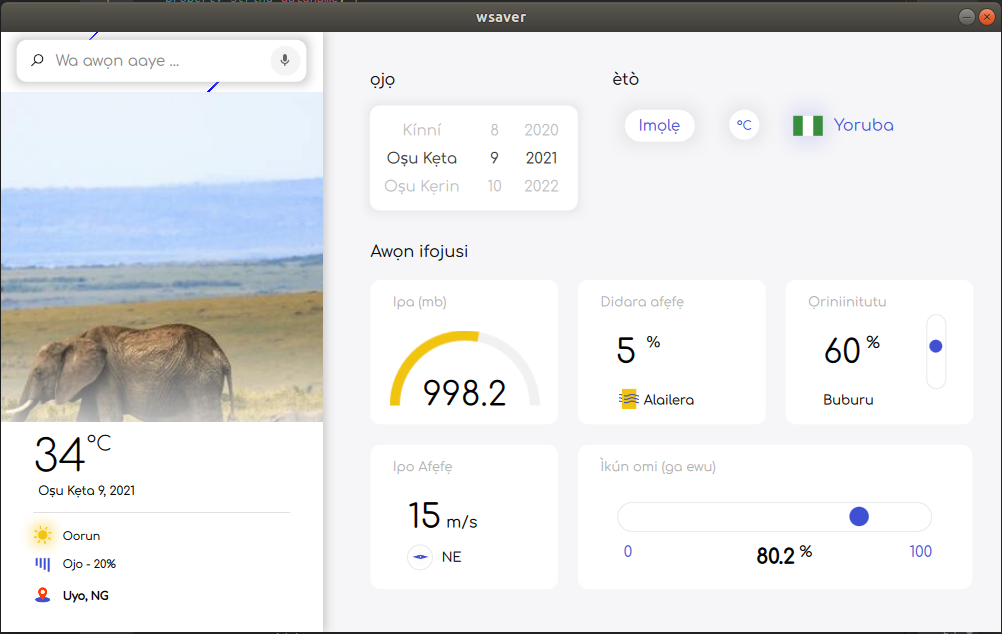
- Choose a language by Selecting a flag (for example the Nigeria flag for Yoruba language).
- Having Light and Dark theme at your convenience.
- Handles many locations (Uyo and Accra), dates, and forecasts data: condition, percent of rain, pressure, humidity, and wind status.
- Forecast adjustable via a backend JSON file (forecast.json) (Ctrl+S after any change so that we can see that data updated on UI).
- Reads in soil moisture(volumetric soil water layer_1 hourly) and in air quality(wind 100m_u hourly) for the given location/date from dClimate's API and shows respectively flood risk and Air quality based on that information.
Infos: To be able to forecast more dates of these two towns, you just have to add a dictionary on the forecast.json / follow this:
{
"town": "Uyo, NG",
"date": "January 18, 2021",
"pressure": 1000.7,
"temperature": 29.5,
"temperature_unit": "C",
"humidity": 77,
"condition": "Cloudy",
"wind": 5,
"wind_unit": "m/s",
"wind_direction": "WSW",
"rain": 80,
"lat": "5.0405866",
"long": "7.9194225"
}
Hint: We are still working on search by voice. We know, it's a crazy idea .